Radial Family Tree
Spring 2025
In collaboration with Aaron Walsman while working on DIRT, an evolutionary simulation with a bunch of replicating agents (“bugs”), we became interested in visualizing short-term family trajectories. Is there one individual that has a ton of children, is everyone alive having just a couple children, or is it somewhere in between? With standard evolutionary tree visualizations, such as dendrograms, we lacked the level of detail needed to really see what was going on. As soon as we got to 30 or so total indviduals, the uneven distribution of children led to visual clumping and loss of interpretability.
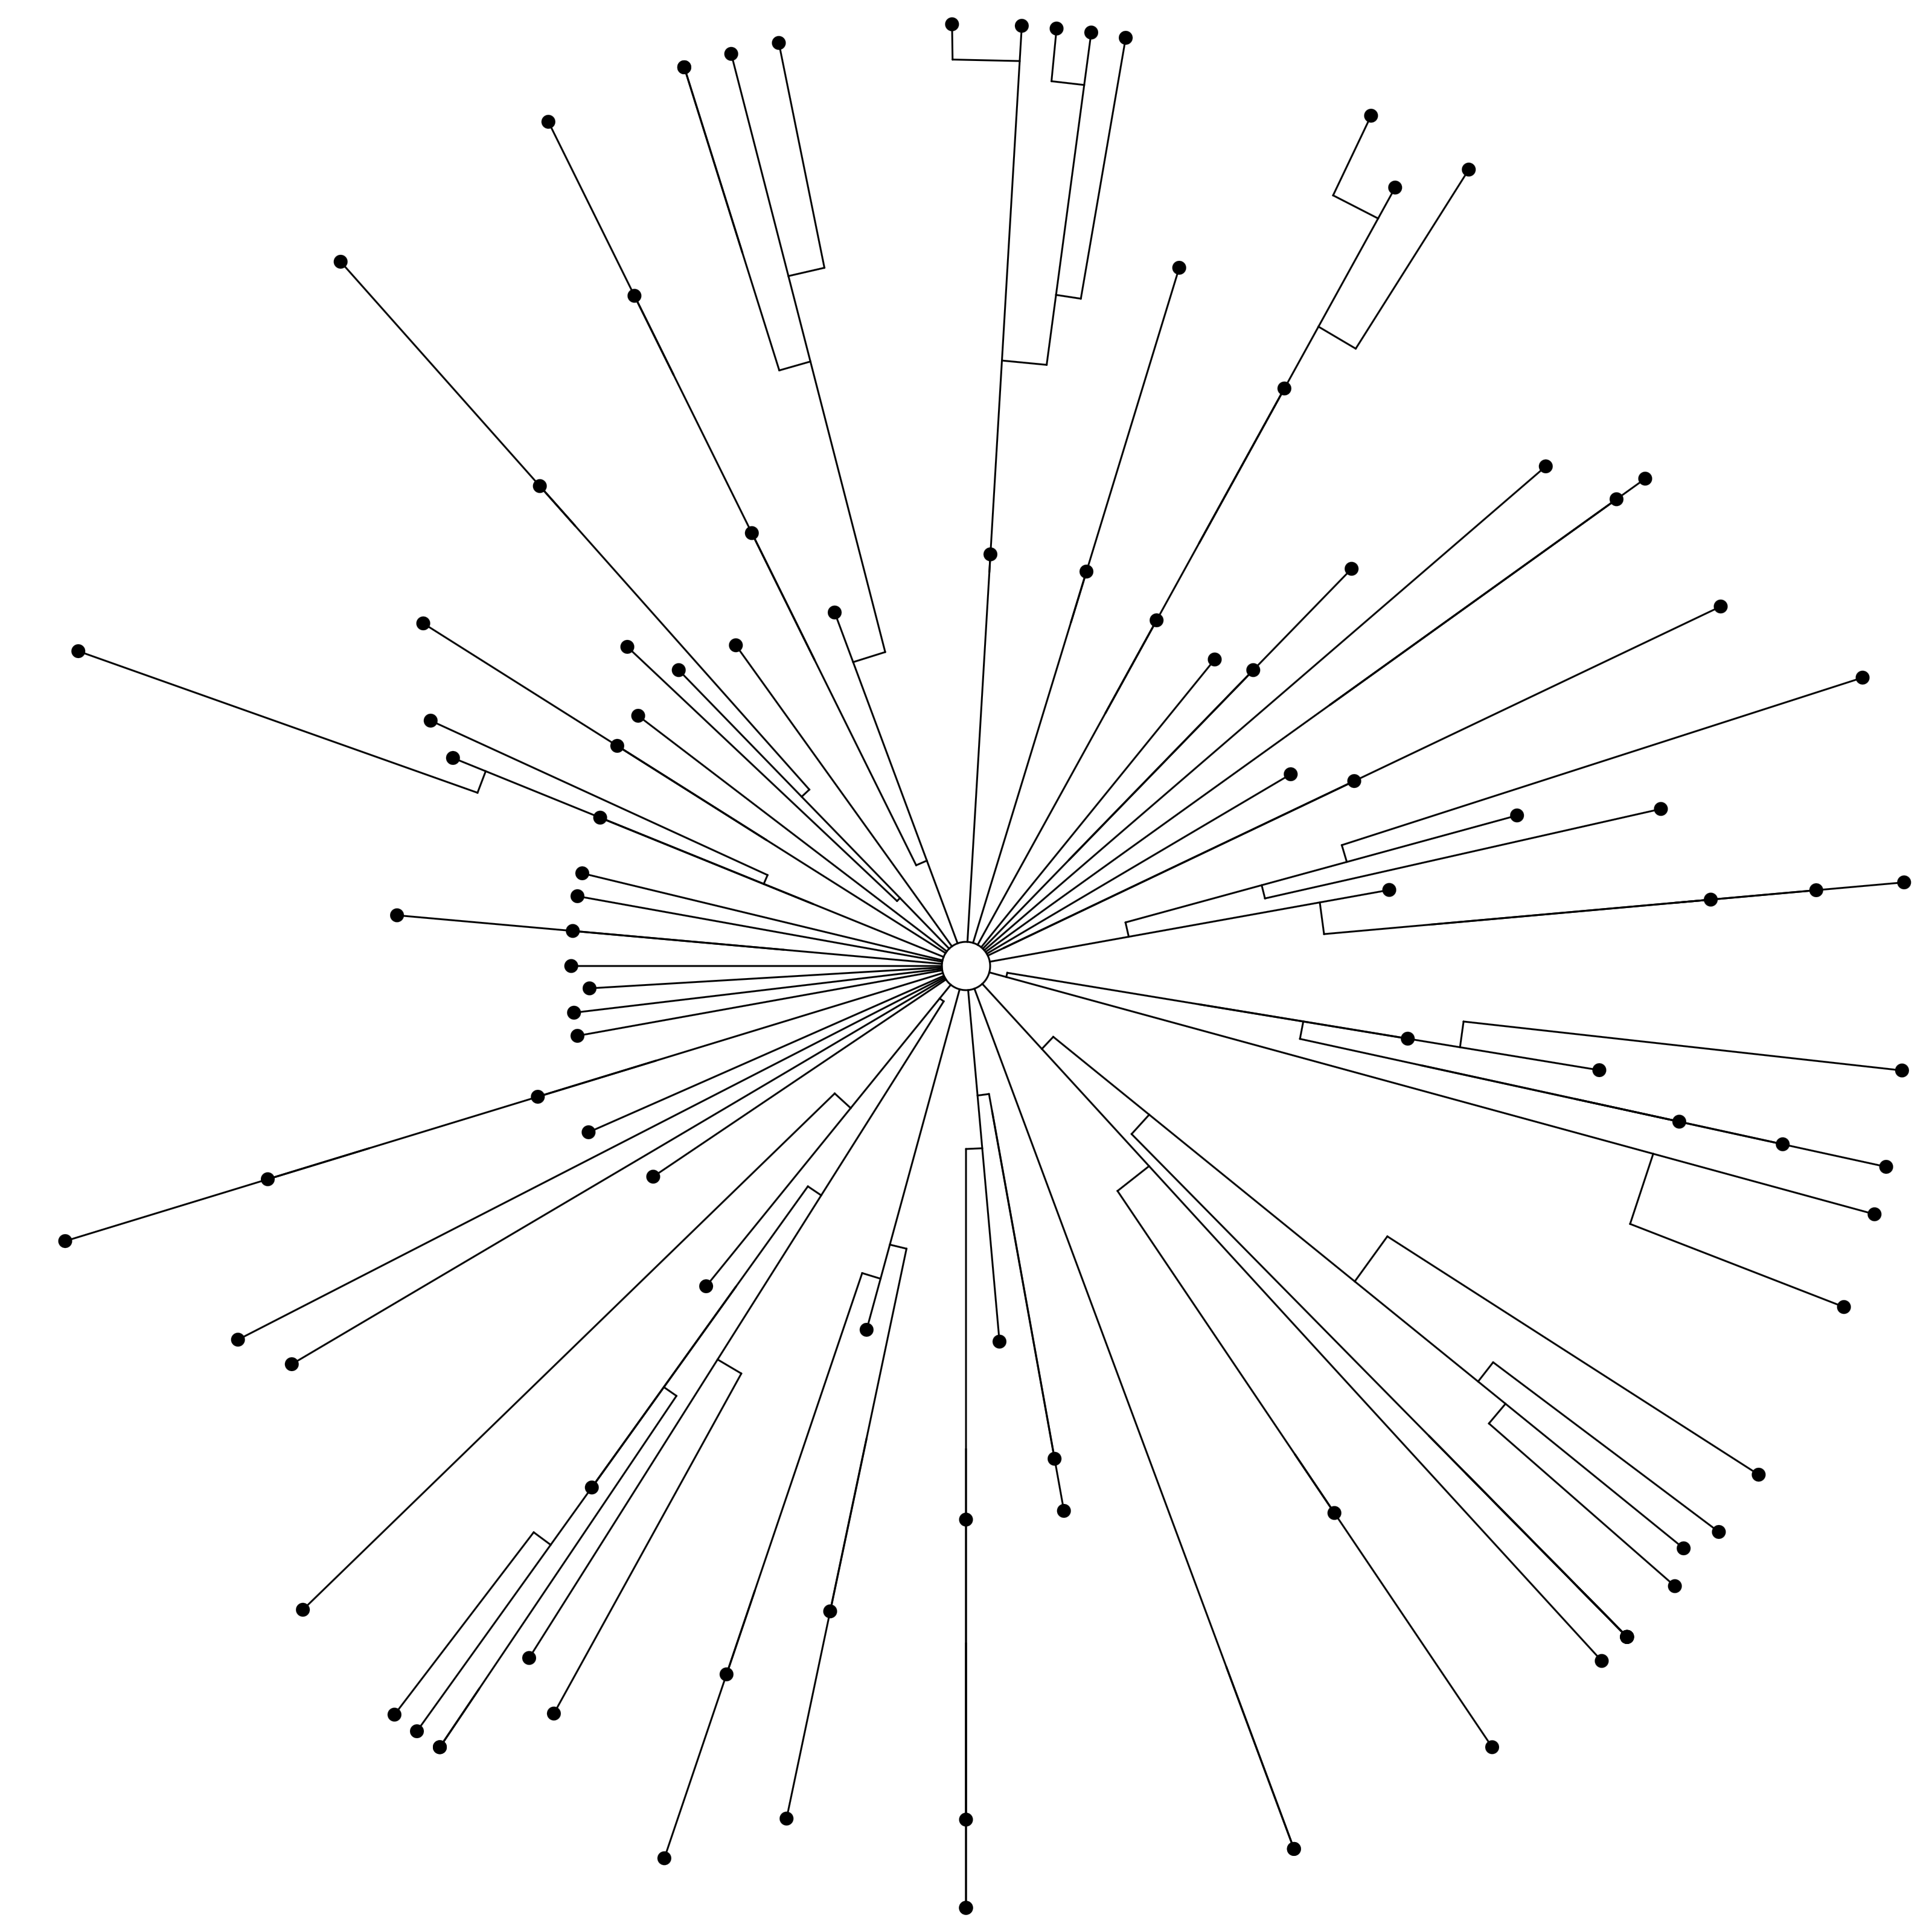
The big difference in our visualization is that we were representing individuals, not lineages. We start with a small number of founders, which replicate over time and increase the total population size. This means we have only a little visual information at the start of the simulation, and get progressively more as the simulation progresses. Dendrograms live in rectangular space, such that their information density limit is the same at any time step. A circle, on the other hand, begins at the center with low visual resolution and increases in visual capacity as you move outwards, roughly proportional to the radius. There are a number of radial evolutionary trees, although my representation is slightly different because it visualizes individuals.
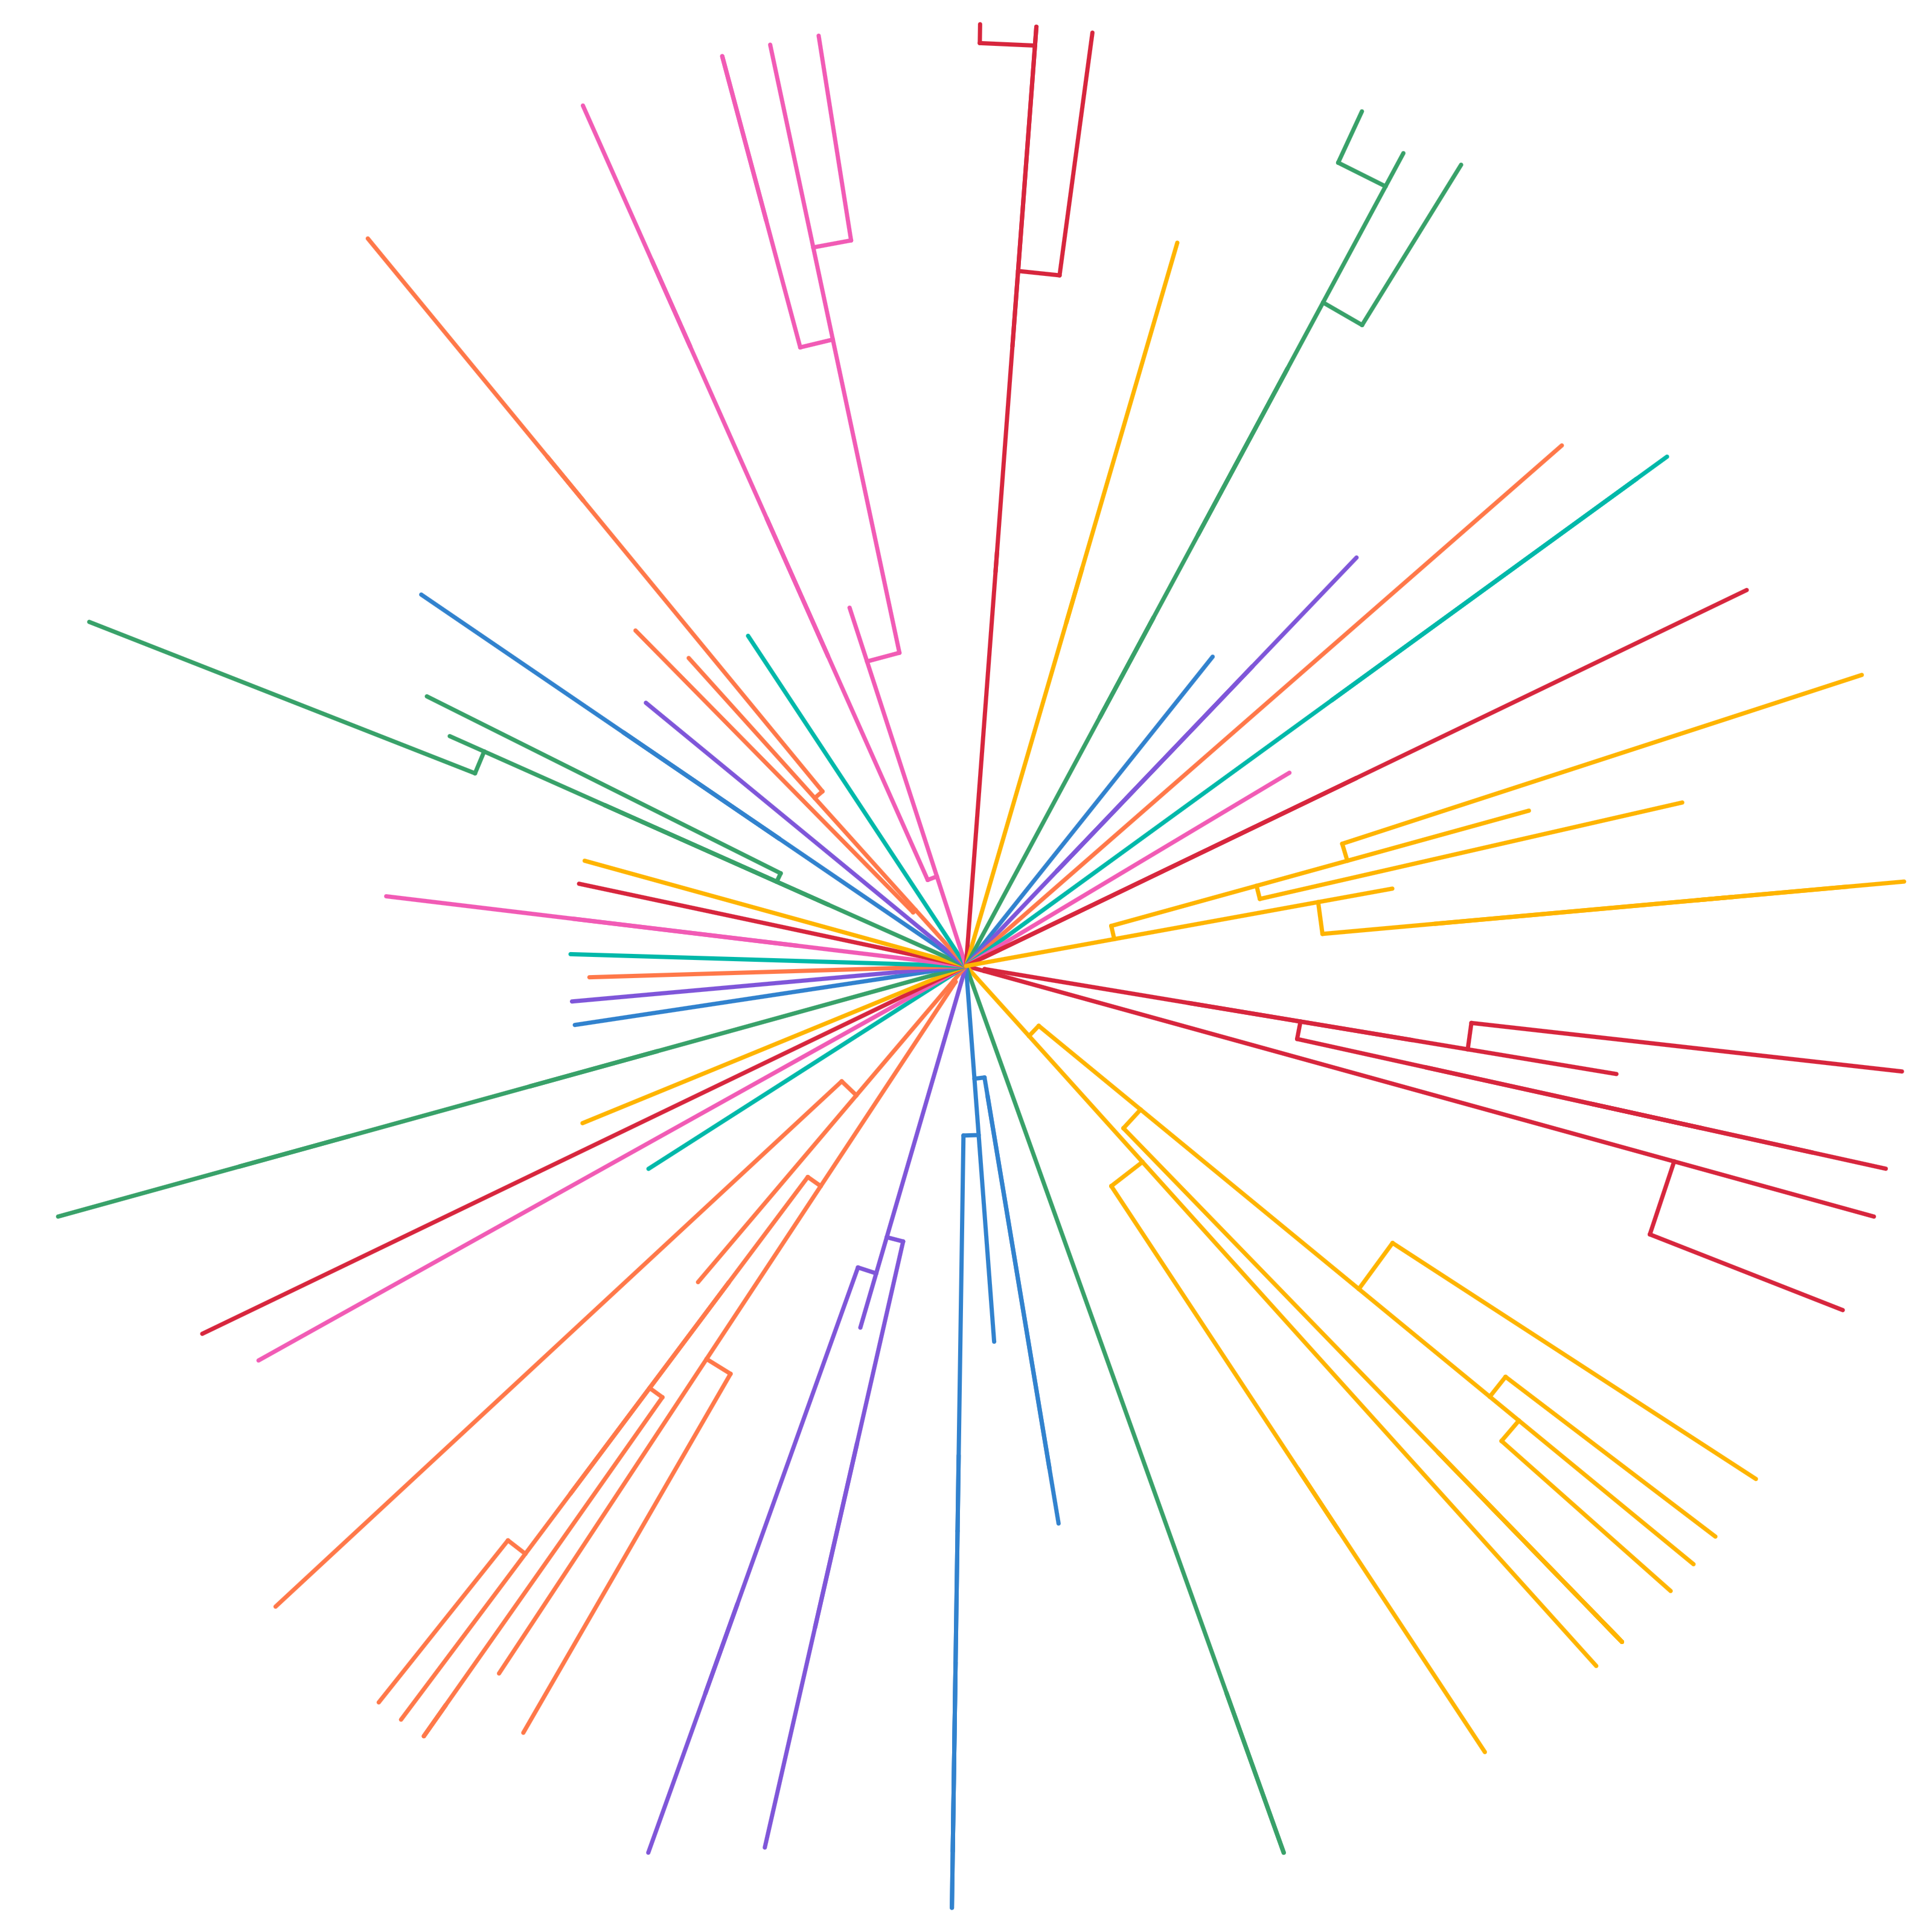
I colored each lineage per founder, which I thought was interesting but a little busy. In addition, it was totally unclear when bugs were dying or replicating. The idea is that each bug’s life follows a line segment moving out of the circle, where branches that form off of a segment are the children. I added some dots to show bug deaths, and I think this made the replication more clear as well. I also started the founders a little bit outside the center of the circle, to induce some visual separation.
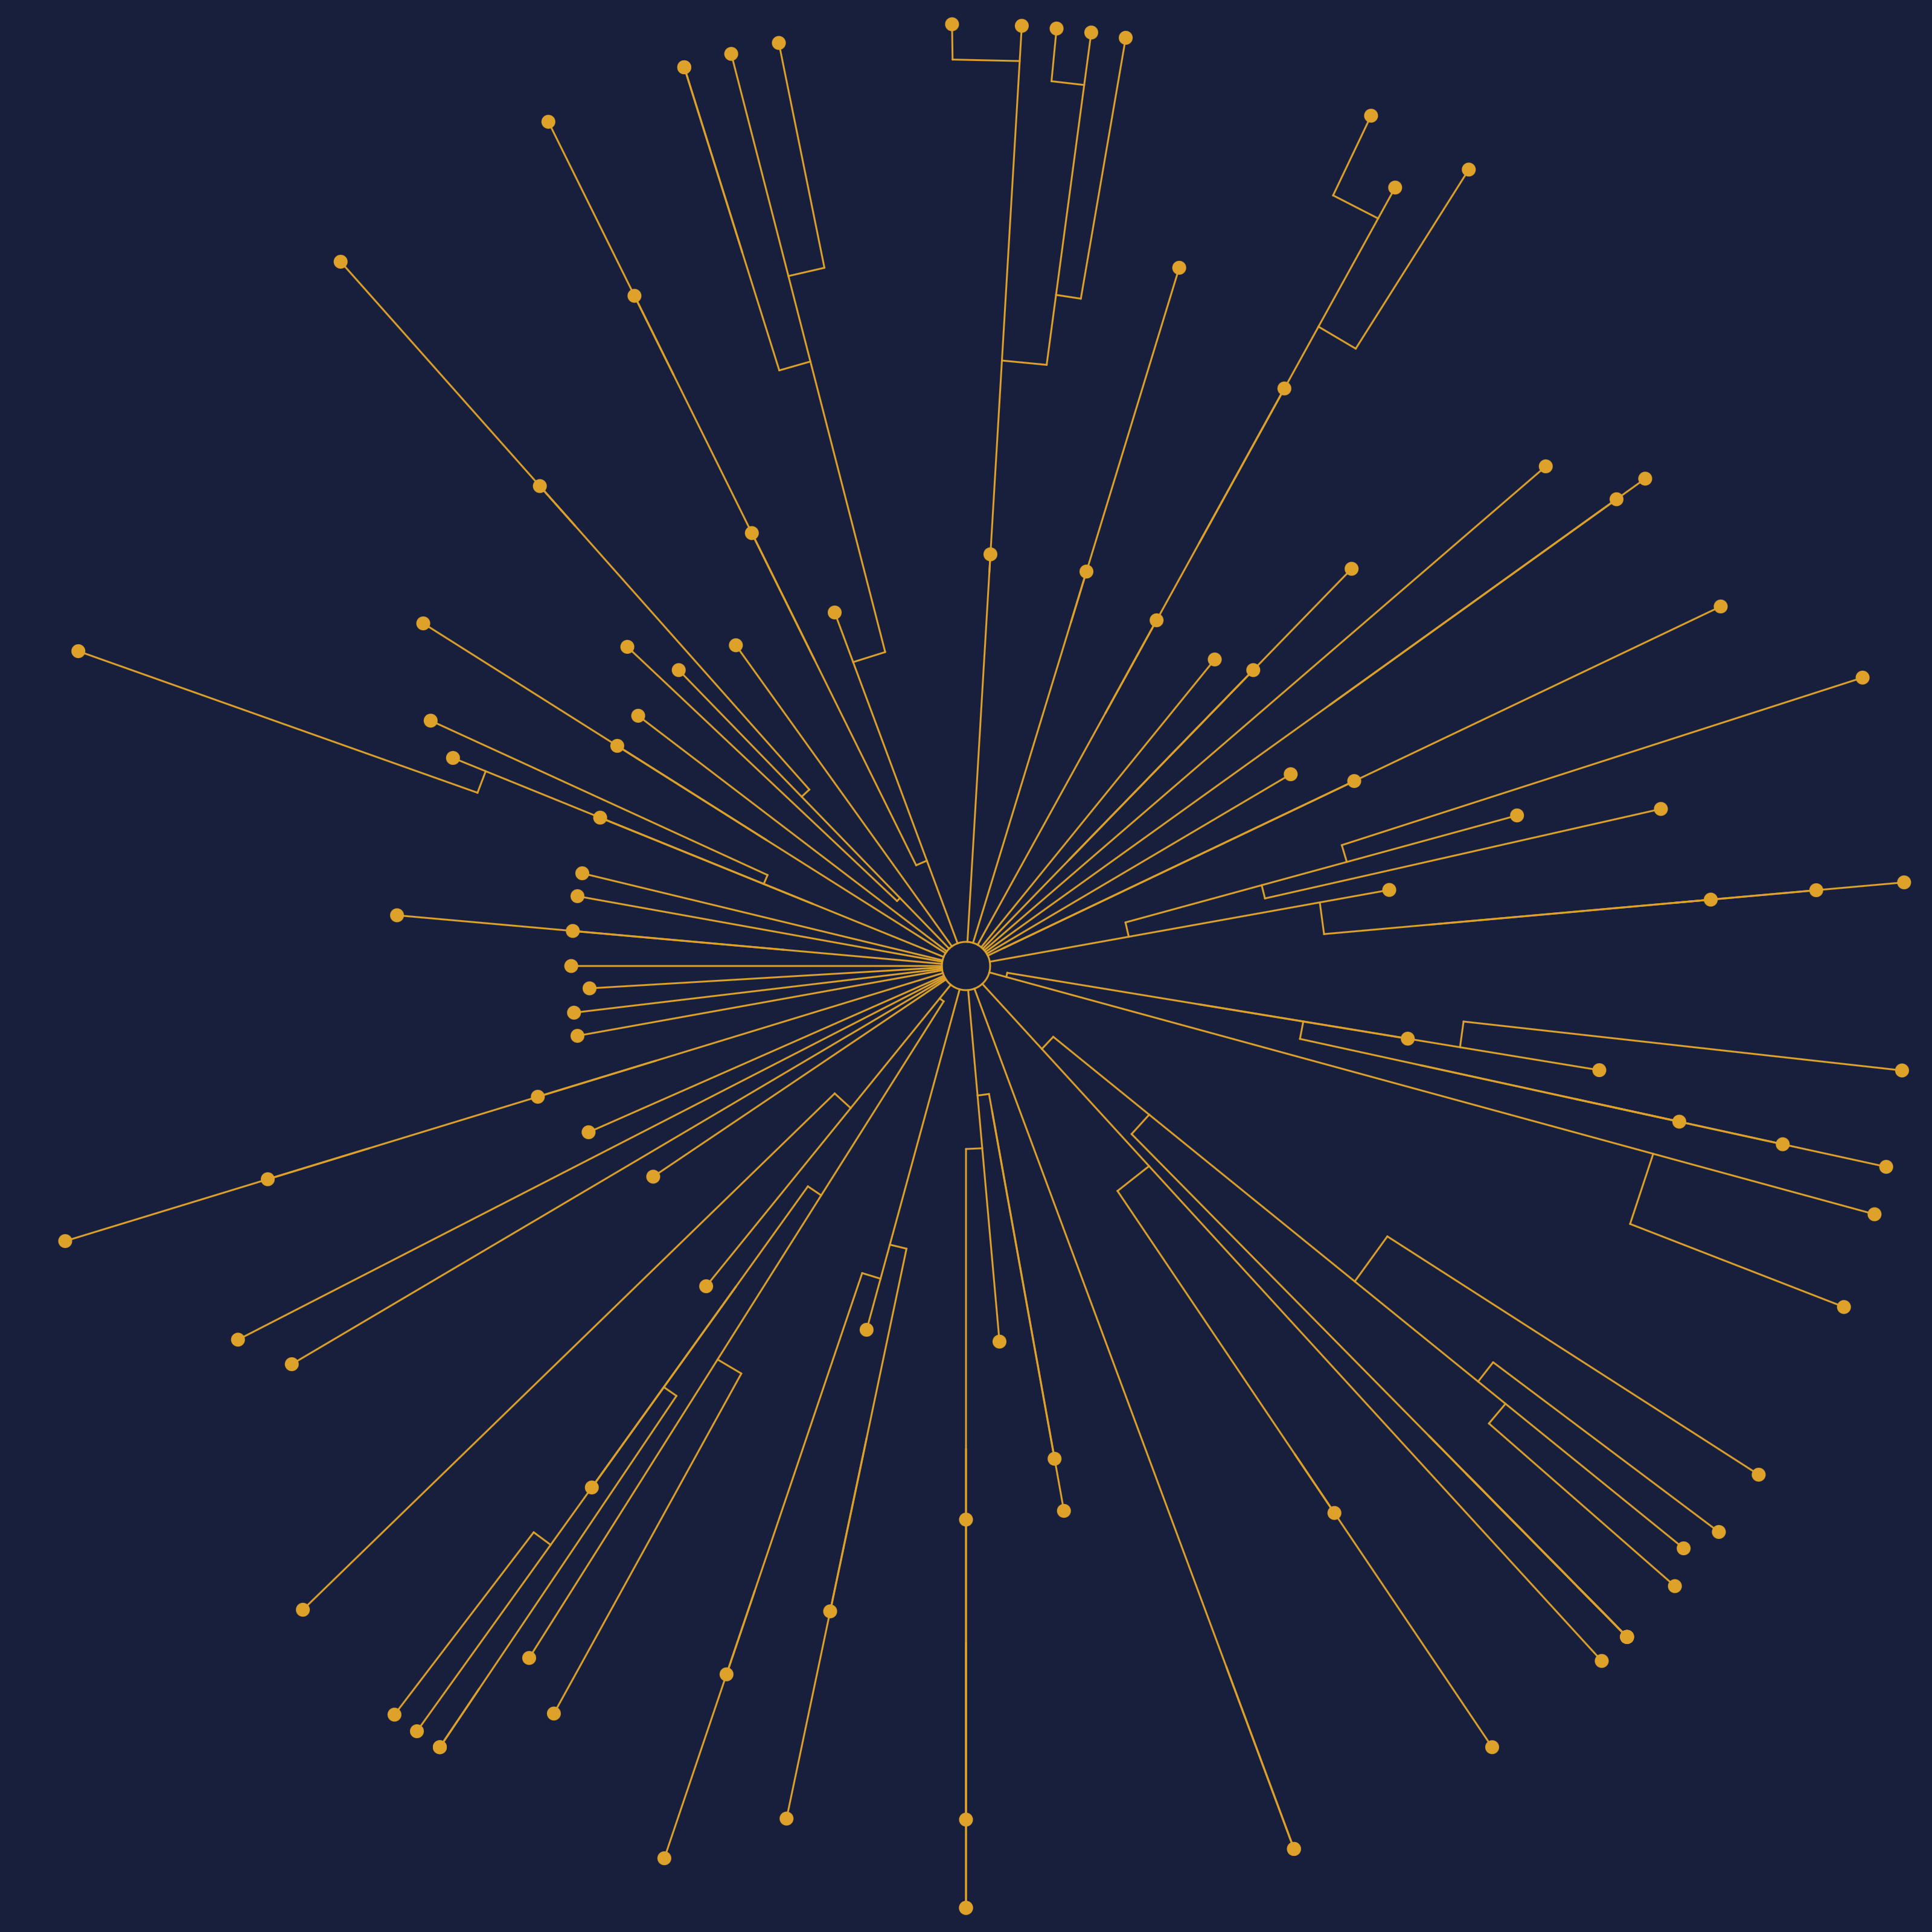
Now, I’ve ended up with something that looks alright, although it isn’t totally clear to read. Still, it was fun to make and I enjoy the visual identity.
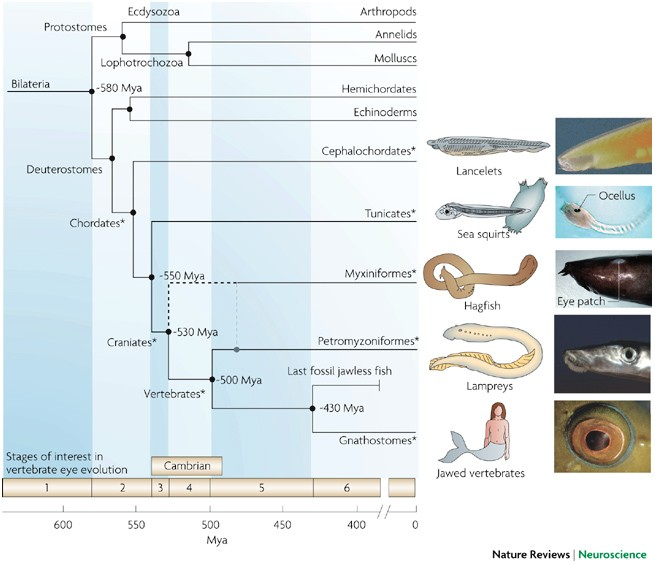
When coming up with the idea, I had a few loose inspirations in mind.
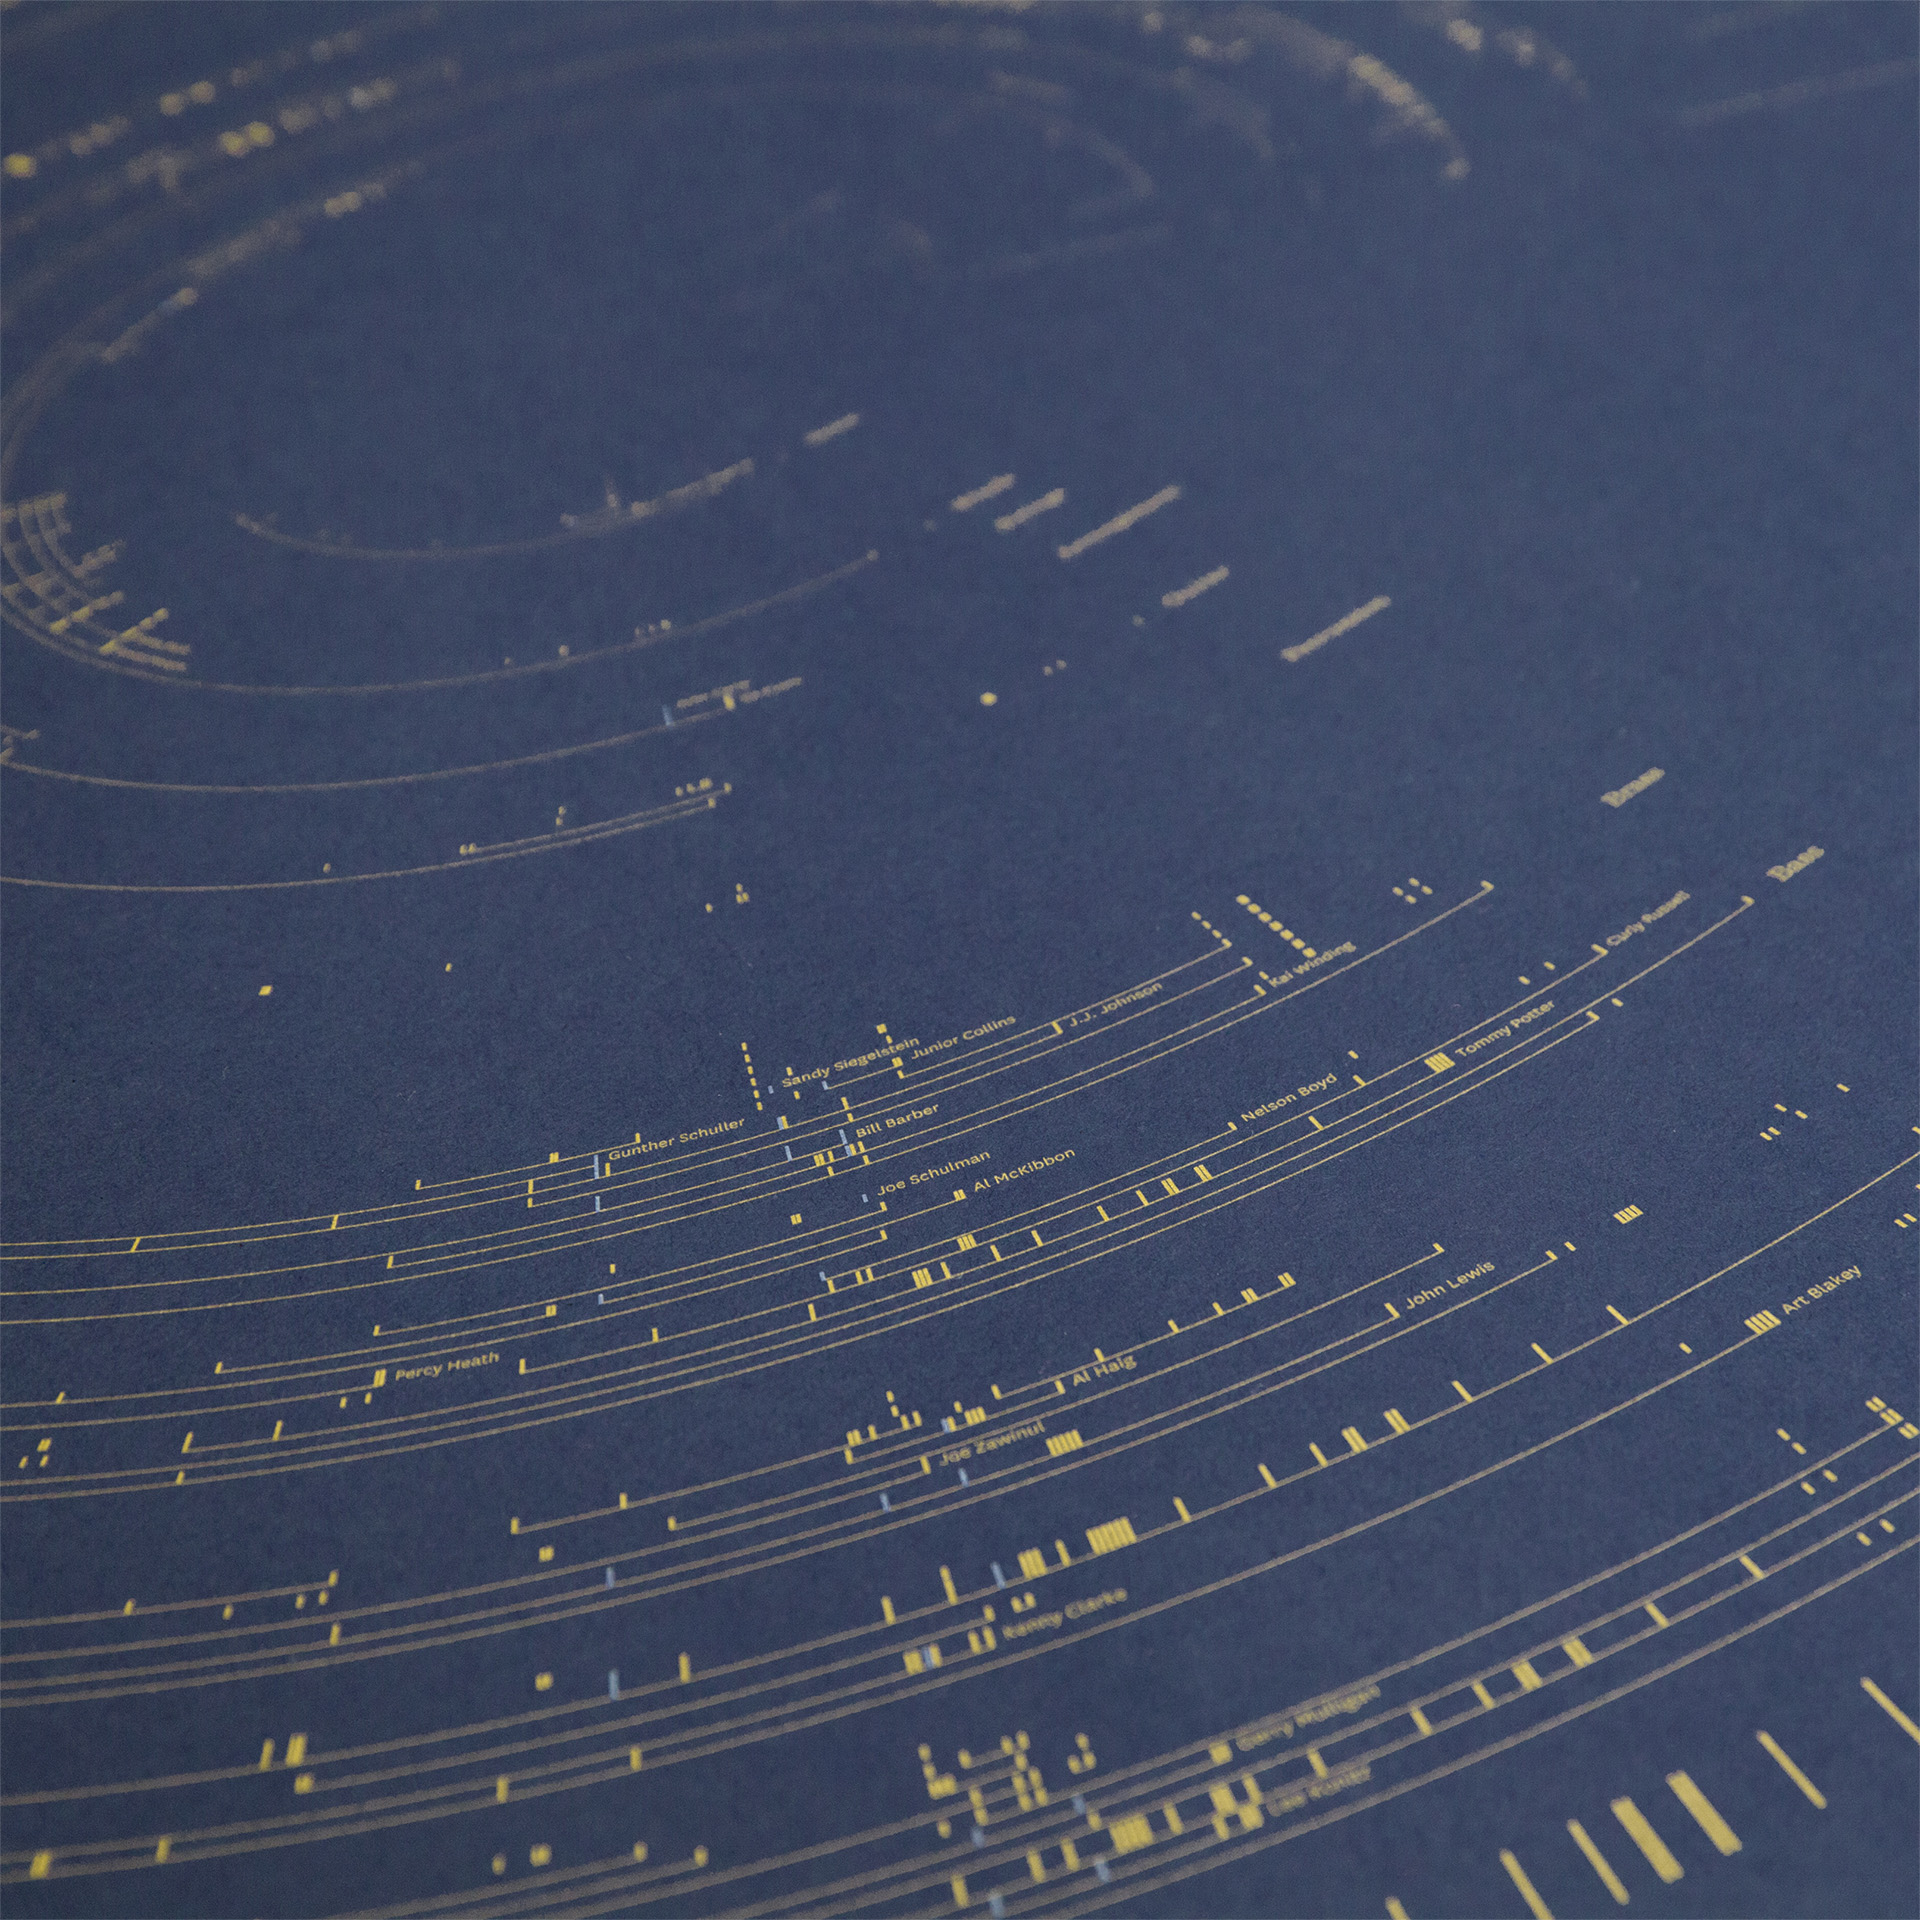
You can see one of my final drafts drew heavily from the color scheme of Fathom’s work.
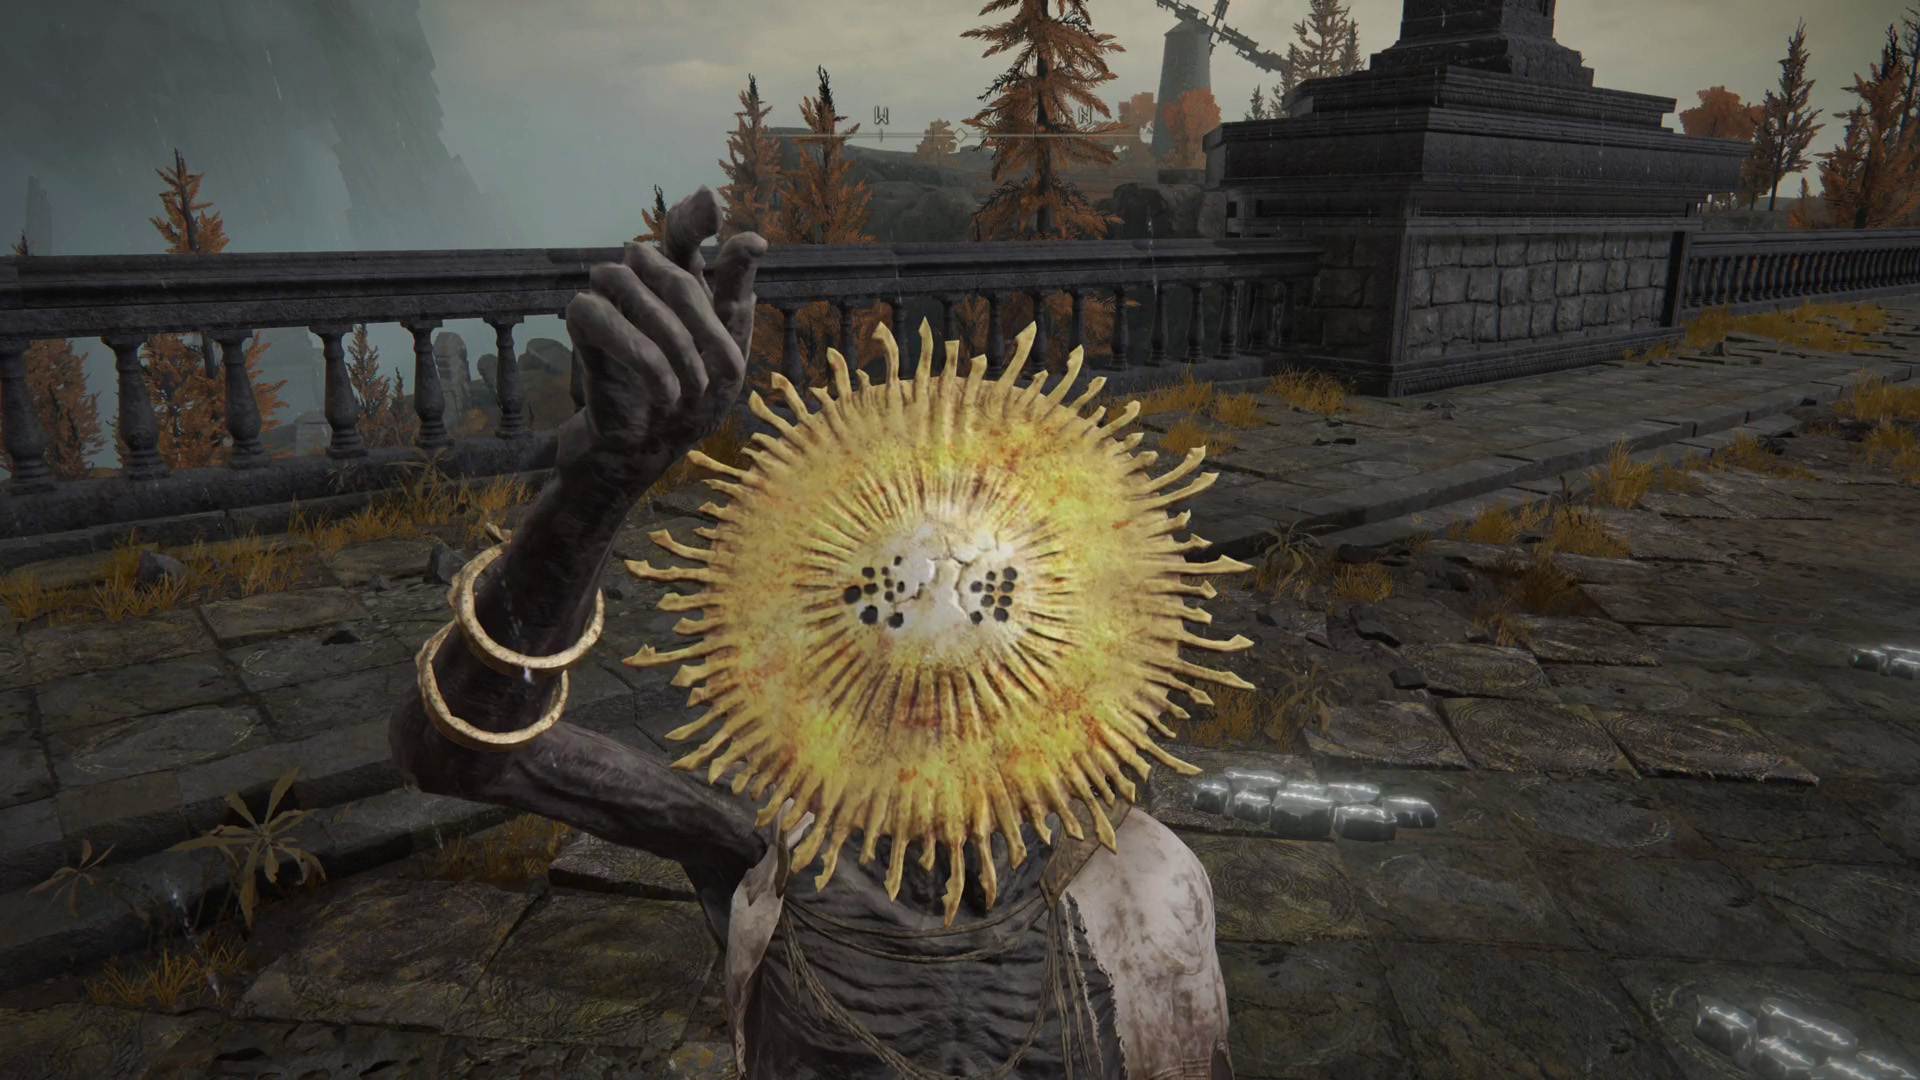
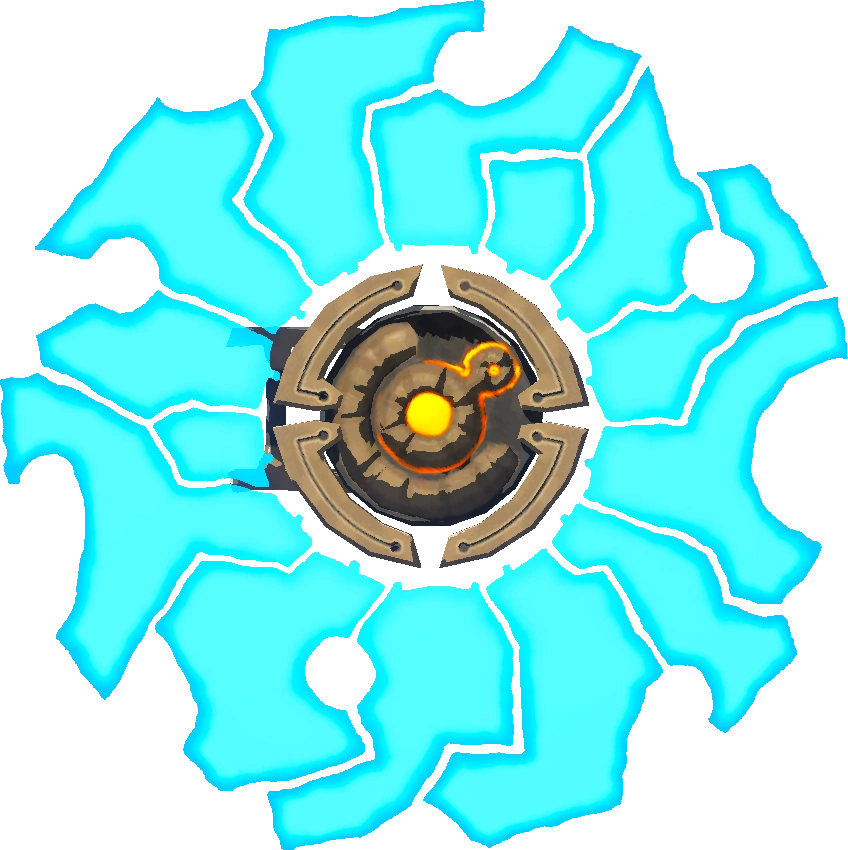
Right: a Guardian Shield from The Legend of Zelda: Breath of the Wild.
Remember, I said loose inspirations. I tend to connect visual designs to video games, most of the time, because video games are pretty fun and visually distinct from other forms of media.
The code for this is available here. The data processing was done in Python, and the code itself is written in JavaScript with p5.js.